I am Preston Gonzales

Electrical Engineer, Johns Hopkins Graduate, Programmer, Generative Artist

About me

Hello! I am Preston Gonzales, an electrical engineer from Idaho. I graduated from Johns Hopkins in 2023 and 2024 with my B.S. and M.S.E. in Electrical and Computer Engineering, respectively. I have a wide range of experience from hardware engineering to deep learning. On this website, you will be able to see what interests me and some of the projects I have worked on in and out of school. Feel free to reach out for more info at gonzalespreston01@gmail.com!

Quick facts

From: Kimberly, Idaho
Alma mater: Johns Hopkins University
Hobbies: Penplotting, rock climbing, snowboarding, and other outdoors activities!

Hands-on experience

Click icons to expand/collapse section

Embedded Microprocessor Programming Interface

CraniUS Hardware Engineering Internship

This project is something I made during my first internship at CraniUS LLC, a company that is making an implantable device to better target brain cancer. A proprietary connector is used to program the device, so this interface board serves as an adapter to the USB debug probe. Making an adapter PCB also allowed us to include some helpful features for debugging and testing, including a heartbeat signal LED, 5V to 3.3V regulator, a slide-switch to connect the device to the regulated voltage, a hard reset button, and some headers for voltage and current measurement. I made this PCB in Altium, ordered it through OSH Park, and assembled it using a hot plate and soldering iron.

programming interface PCB

I enjoyed working on this project because it was one of the first PCBs I made and I was very pleased with how well it turned out, especially how useful the added features have turned out to be. It gave me a good intro to designing a circuit using an IC and laying out the PCB in a way that is easy to use and provides useful debugging information.

Synchronized singing boxes

Senior Design and Graduate Independent Study Project

This is a project that I first got involved with in my senior year. The main idea around the project is to create a sort of swarm protocol that allows for an undetermined number of devices to wake up and self-coordinate to perform individual actions unique to each device. In this case, the goal of the project was to create singing boxes that would each play a different part of the song to create a chorus effect. The project had been started by a previous group of students, but they had only achieved basic radio communication between two devices with predetermined states. I worked on this project by myself during Fall 2022 and with a partner in Spring 2023. Currently, I am leading a team of two undergraduate students to continue working on the project. Over the 2023-24 academic year, we were able to implement the protocol we created on Arduino Unos. See here for a video of the demonstration and below for the project poster from Spring 2023.

programming interface PCB

The protocol we designed for the demonstration uses hard-coded tracks to play for each device since we had little figurines with their respective instruments next to each device. However, the protocol also allows for devices to perform different actions if necessary, and they are aware of what actions other devices are performing to avoid performing the same action as another device. Additionally, the protocol can handle devices that die or come online while the network is active, making it well-suited for applications where devices may be activated or deactivated frequently.

programming interface PCB

In the video, you may notice that it takes several seconds for the devices to get started. This is a weakness that we are aiming to solve during the Spring 2024 semester by moving the protocol over to Raspberry Pis, which are much more powerful and allow us to utilize better hardware. Additionally, we are aiming to generalize the protocol further to expand the scope of the project and potential applications. This project has a provisional patent application filed and we are hoping to prove it has meaningful innovation to bolster the application.

Computer vision guitar transcription

Class project (2023)

In this project, my group and I utilized different techniques to transcript guitar fingering positions from a video of a guitar player. My group considered two main approaches to this problem. The first of which is a deep learning CNN-based method using labeled frames as training data. The second method is a more traditional computer vision approach, breaking up the process into smaller steps: segmentation of the fretboard, centering/tracking of the fretboard, string and fret location estimation, and finger position extraction. My main contributions to the project were the frame auto labeling pipeline for the deep CNN approach, fretboard segmentation, and fret position calculation for the traditional approach.

programming interface PCB

The frame auto labeling pipeline is used in the deep learning approach so we did not have to manually label the note being played in each frame. This approach is limiting because it introduces some inaccuracy into our training data and it doesn’t allow for distinction between a D played on the 5th fret of the E string, or an open D string. However, the main advantage of this pipeline is that it allowed us to train using many more images than we would have been able to use by hand-labeling. I used my signal processing knowledge to adapt an existing project using the Harmonic Product Spectrum (HPS) as a polyphonic note detector to suit our needs. For a quick explanation, HPS uses scaled versions of the Fourier transform to find the fundamental frequency of a note that is being played. See the image below for a visual representation (credit). In order to detect multiple notes, we simply search for multiple large peaks that surpass a magnitude threshold. Using the labeled notes from this pipeline, we trained a CNN to output the note based on a frame of a video. The results of this approach shows that it can somewhat learn the finger positions, but is very difficult to generalize for any images that look different from the training data. An approach that might work better is to combine an audio classification model and CNN to utilize the audio and video information, but this would require full videos to be hand-labeled, which is something we did not have time for in the semester.

programming interface PCB

The traditional computer vision approach to this problem needs to locate the four corners of the fretboard in order to calculate finger locations relative to the fretboard. I found a dataset on Kaggle that contained exactly the labeled images we were looking for, so I decided to attempt this segmentation using deep neural networks. The only issue was that this dataset was produced by some college students so it was very limited in size and variation. I attempted training multiple variations of CNNs and multi-layer perceptrons, plus a pre-trained semantic segmentation network from the torchvision.models library, but none of the networks had enough training data to produce consistent enough results on the test data (see example image below). This does seem like a problem that would be well suited for a CNN if there was a large and diverse dataset. I used multiple tools to try and improve the model’s performance with the data we had, such as random rotation/cropping, dropout, batch norm, edge detection, and contrast enhancement preprocessing. While some of these were able to prevent the model from obviously overfitting on the training data, the loss when applied to the test set was still too high for us to use. If I were to do this project over again, I would have just expanded the dataset by hand-labeling my own images, but I was over-confident in the capabilities of neural networks in this task. Despite the unsatisfying results from this part of the project, I recognize the lessons it taught me about creating a custom neural network for a somewhat uncommon task.

programming interface PCB

Left Ventricle Segmentation and Stroke Volume Estimation

Class project (Spring 2023)

In this project for my medical image analysis class, I worked with a partner to create a 3D reconstruction of the left ventricle of the heart from ultrasound sequences. This allows for us to estimate the stroke volume and ejection fraction of the heart, which are measures of heart health. The data we were given to work with was a set of 2- and 4-chamber view cardiac ultrasound sequences. These two views are assumed to be orthogonal to each other.

programming interface PCB

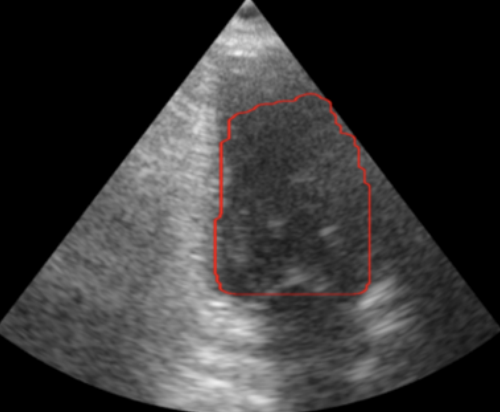
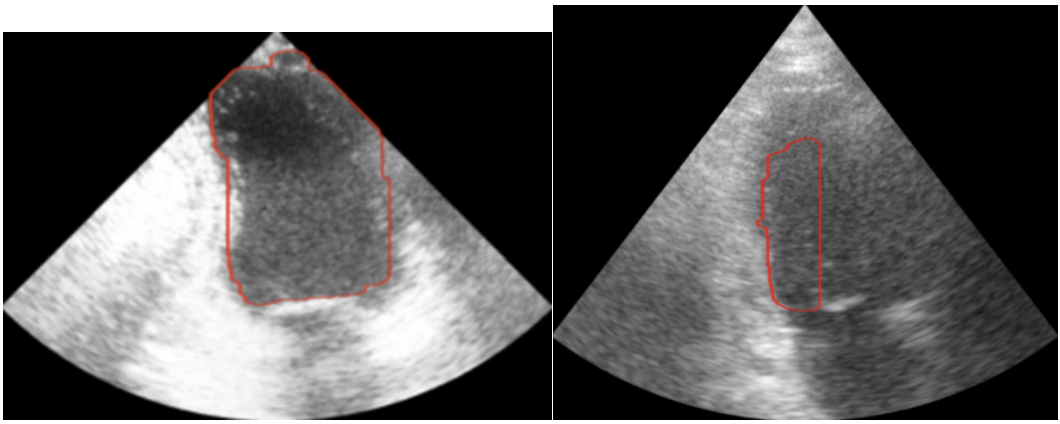
The first step in this project is to segment (find the outline of) the left ventricle. Segmenting the images is the crux of this project because the accuracy of the 3D representation depends entirely on the segmentation accuracy. Other papers used deep learning to segment the ventricle, but we were more interested in using the image analysis techniques we had learned in class. Using a traditional approach to this segmentation problem proved to be extremely difficult because of the poor quality of ultrasound images. We used a variety of techniques to normalize, denoise, and threshold the images, but our results certainly fell short of other groups that used a deep learning approach. Over the entire dataset, our segmentation technique produced a Dice score of 0.6, where a score of 1 corresponds to perfect segmentation.

programming interface PCB

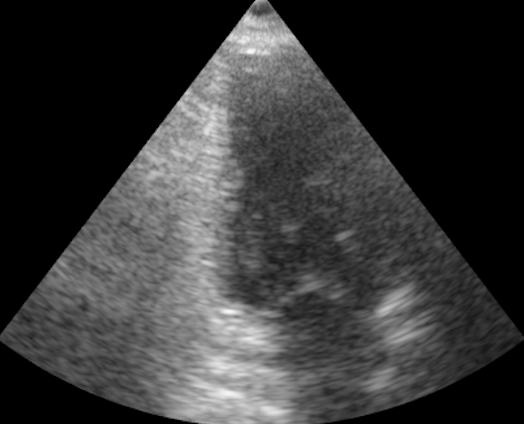
Due to the nature of this hand-crafted algorithm, the hardest part was obtaining consistent results across all the images in the dataset. As you can see in the example below, some images produce very solid results, whereas others are very poor. Despite this algorithm not performing as well as we had hoped, it was a great challenge for us to apply the techniques we learned in the class.

programming interface PCB

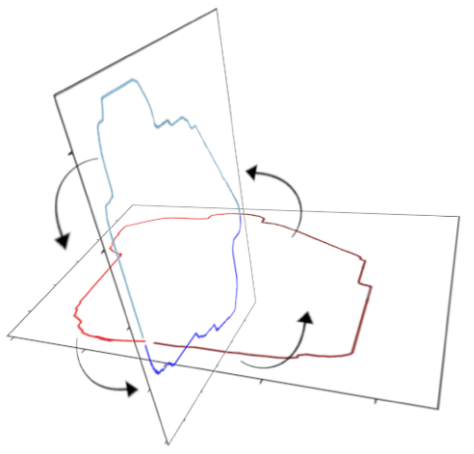
For creating the 3D representation, we leveraged the assumption that the 2- and 4-chamber views are orthogonal to each other. This allows us to essentially interpolate from one set of points to the other set of points to generate points on intermediate angles. See the images below for a visual representation of the algorithm and result.

programming interface PCB

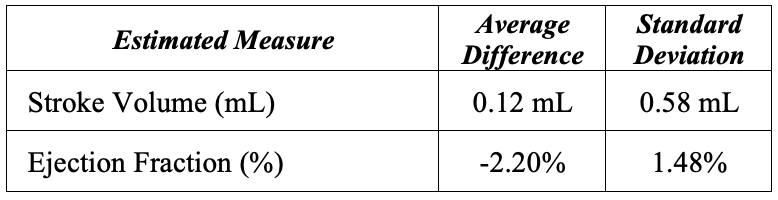
The last part of this project is estimating the stroke volume and ejection fraction for each ultrasound sequence. It was simple to calculate the volume using our 3D surface, but we then had to convert it to mL. Upon plotting our pixel volumes vs physical ground truth volumes, we were able to see that our estimated volumes were not linearly correlated with the physical volumes. Thus, we used an exponential regression to scale our pixel volumes to the physical volumes. See the table below for the average difference and standard deviation over the entire dataset. These results surprised us in how close they were to the ground truth. I would attribute this to the exponential regression correcting the skew produced in our model.

programming interface PCB
Despite the lackluster results of our algorithm in the segmentation task of this project, I was pleased that we still created an end-to-end algorithm for a useful measure of heart health that’s based off of an uninvasive ultrasound. This project challenged me to be creative, not only in the image processing methods but also creating a 3D model from two 2D images.

Speech Enhancement

Class project (Fall 2022)


This project is from my Audio Signal Processing class, where the goal to implement a basic speech enhancement algorithm using spectral subtraction. Spectral subtraction is an algorithm where an estimate of noise is subtracted from speech signals in an ettempt to reduce background noise. In order to accomplish this, the audio clip is first windowed using a windowing function (e.g. Hamming window) and split into partially overlapping frames, where each frame is generally ~20ms long. This algorithm assumes that the first frame of audio has no active speech, meaning that the first frame of the audio signal is the first noise estimate. For subsequent frames, voice activity is detected using a voice activity detector (VAD). The VAD works by calculating the spectral difference between the noise estimate and current frame, and if the difference surpasses a specific threshold, then the current frame is determined to be voiced. If a chosen frame is not voiced, then the spectrum of the frame is averaged with the noise estimate to update the noise estimate. If a chosen frame is voiced, then the spectrum of the noise estimate is subtracted from the frame. See the spectrograms below to see how the algorithm affects a noisy speech signal.

clean signal spectrogram
noisy signal spectrogram
denoised signal spectrogram

In the above spectrograms, you can see that the speech is visibly less clear with noise added than the original signal. After performing spectral subtraction, the speech is obviously much clearer and there is much less noise even when there is no speech. One of the shortcomings of this algorithm is that the real noise is not always accurately depicted by the noise estimate. This can leave residual noise in the signal or it can remove some of the actual speech signal, as can be seen in the area outlined by the red box above. Residual noise will often have isolated peaks that produce an audible artifact called "musical noise". We found that there are some ways to try and remove musical noise, but we didn't have time to implement those.

Doing this project gave me a solid understanding of the Short-Time Fourier Transform and an idea for how difficult it is to denoise audio signals. As is the case with many hand-made algorithms that I have experimented with in my projects, I found that it is difficult to make something that performs consistently across varying types and magnitudes of noise. Looking back on this project, I would be very interested in using deep learning to solve this problem as well and see how it compares.

Hobbies

Pen plotting, outdoors activities, and more!